Wednesday, October 18, 2017

Interactive elemental maps


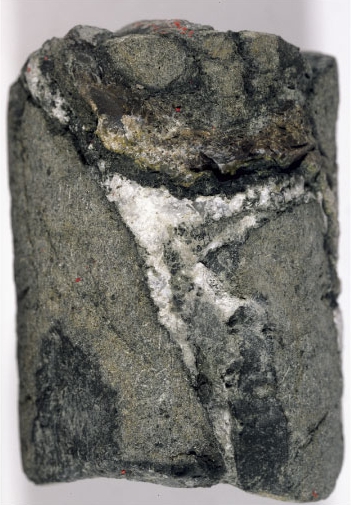
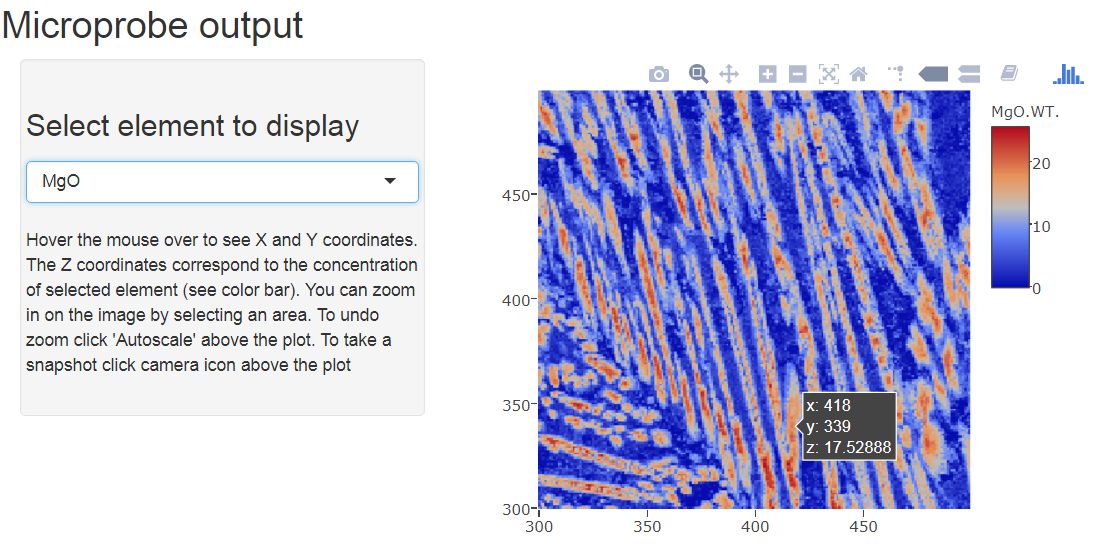
This post features interactive elemental maps that were created for plotting electron microprobe analysis (see previous entry). Now you can visualize the output without needing to install any software. Elemental maps show distribution of concentration for each element in spacial 2D coordinates, X and Y. In this particular example a komatiitic basalt with some alteration is used. You can navigate the analysis by choosing different element and hovering the mouse over the image to see the concentration of the chosen element (Z axis). 

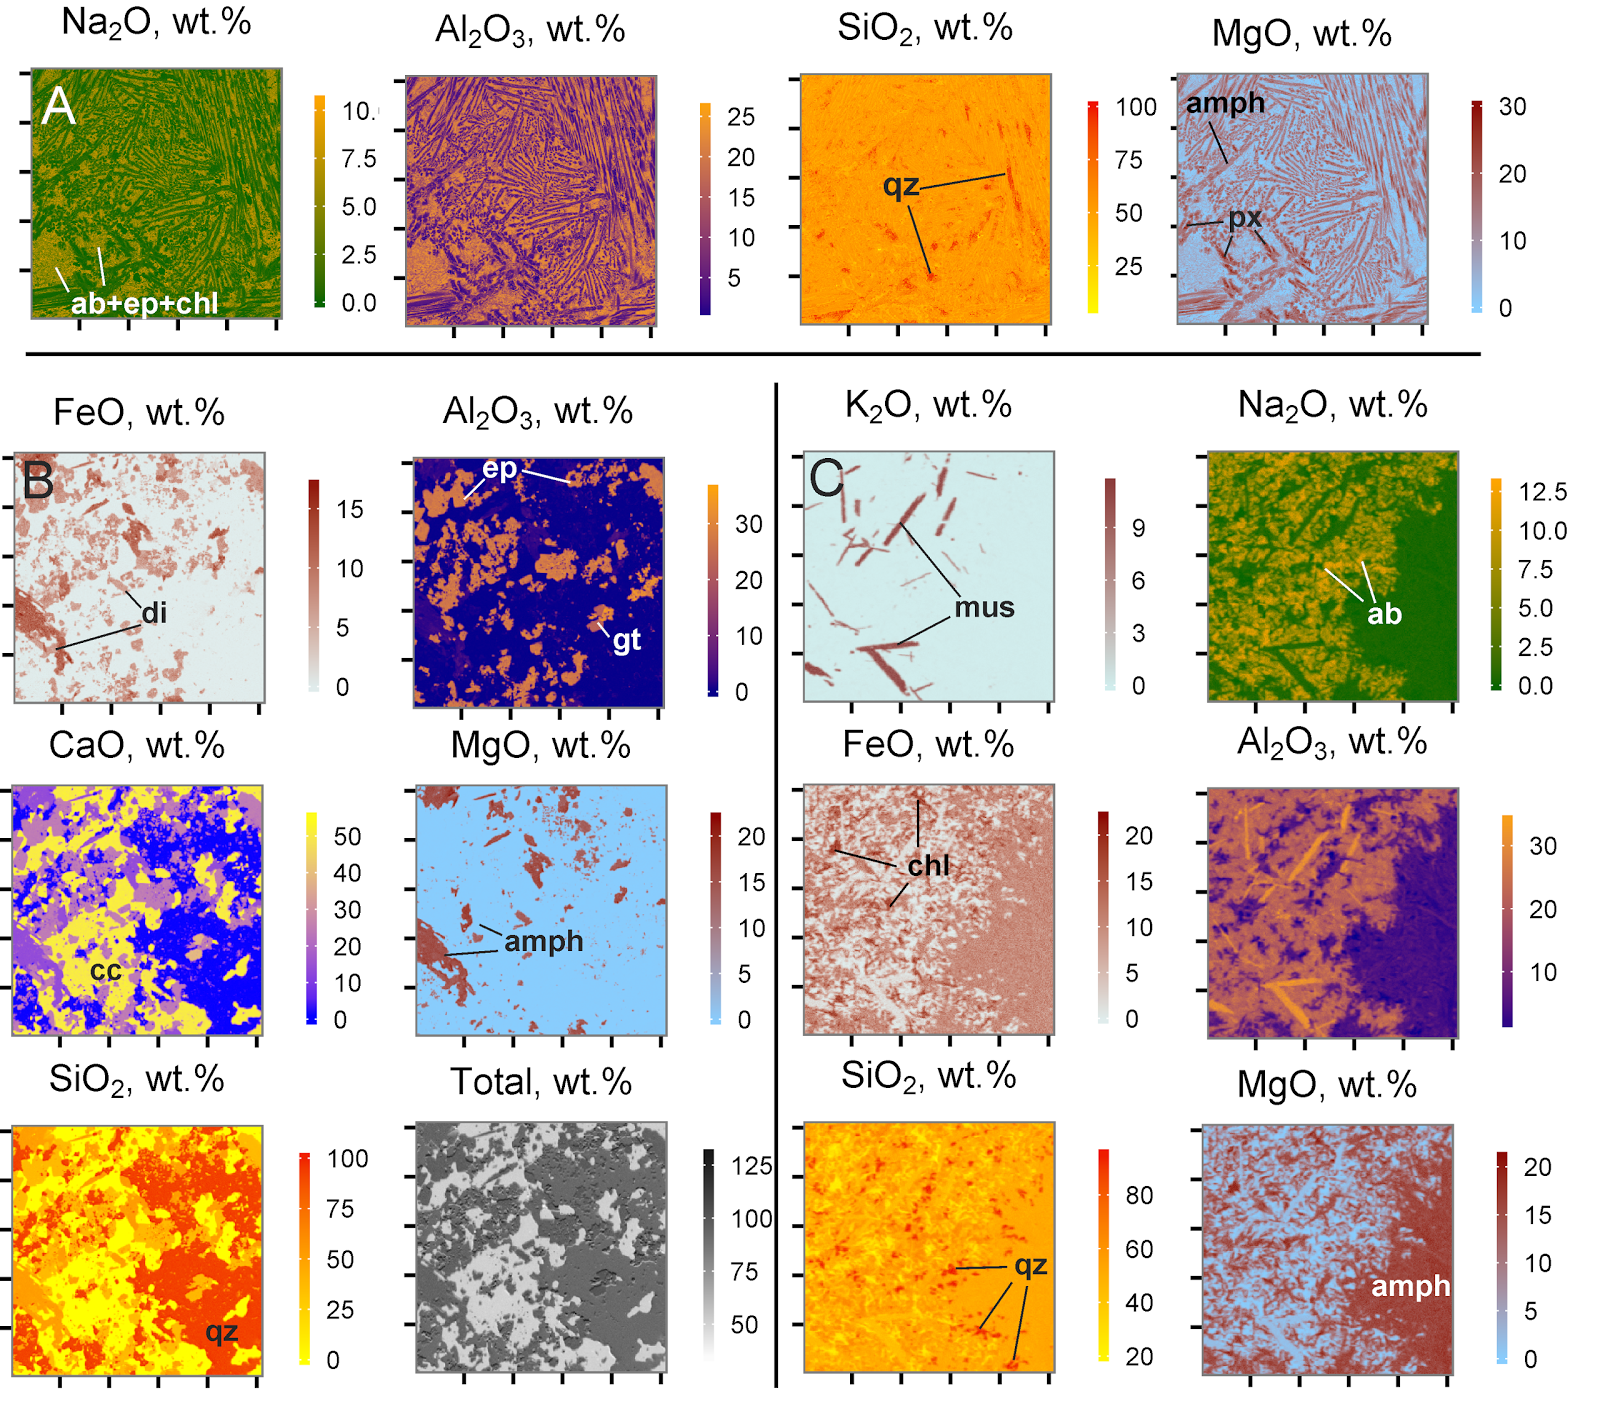
The colors reflect the concentration corresponding to the wt. % value on the color bar. When Al2O3 is selected (default), elongated grains of clinopyroxene are shown with blue color (relatively ow Al2O3). This can be compared to concentration of other elements: high Ca, high Mg. This is a pyroxene pigeonite-augite. If the sample studied in SiO2 mode, one can clearly see quartz - red patches denote high concentrations of silica.

THE LINK TO INTERACTIVE MAP

The code is written in R with plotly package for plotting ans ShinyApp package  to create an interactive output. Let me know if you would like to try this code for your own elemental maps. 

Saturday, October 14, 2017

Automated petrography: electron microprobe mapping

 altered basalt from modern seafloor
(ownership: http://www-odp.tamu.edu/)

In the world of geochemistry every sample requires a detailed description. To make sense out of isotopic/chemical measurements it is important to know what each sample is composed of and how much of each component is present. One of my project deals with ancient altered basalts - something not a lot of people like to look under microscope at because of absence of primary minerals and general "mess" composed of secondary minerals. Basalts are commonly fine-grained in the first place and alteration can make them particularly microscopic; they are altered to fine-grained aggregate of  secondary minerals - chlorites, serpentines, epidotes, amphiboles and other minerals of hydrothermal origin. Even under petrographic microscope these minerals are sometimes indistinguishable from each other. In my study, I used microprobe analysis to go around this problem. With help of John Donovan from the electron microprobe analysis lab at the University of Oregon, we programmed the instrument to create maps of elemental distribution. Resulted images are posted below. I selected most contrasting elements for each sample and plotted them using R package ggplot2. Each pixel in these images represent an electron microprobe analysis.
 Panel image: A - altered basalt with komatiitic texture. Image size is 500 um along the side; B - a quartz-calcite vein with epidote, amphibole, diopside and garnet; C - fragment of altered pillow that is altered to muscovite, chlorite, amphibole and albite (200 um along the side). Abbreviations: albite (ab), amph (amphibole), cc (calcite), chl (chlorite), di (diopside), gt (garnet), ep (epidote).

Now having these images and tens of thousands of analysis I can derive composition of each mineral with very high accuracy. Using some programming algorithms I extracted a composition of a given mineral from each image and processed them to compute formula units of each mineral. Below is results plotted on classification diagrams for epidote (A), pyroxenes (B), Ca-amphiboles (C) and chlorites (D). White transparent fields are plotted using literature data on modern altered basalts (drill hole ODP 504B, eastern Pacific Ocean).


 Panel image: A - analyzed epidotes plotted on classification diagrams using end-members - epidote (Ep), clinozoisite (Clz) and two times piemontite (2Pmt); B - analyzed clinopyroxenes plotted on classification diagram for calcic pyroxenes; C - analyzed calcic amphiboles plotted on classification diagram (after Leake, 1978); D - analyzed chlorites on classification diagram (after Hay, 1954). White transparent fields are using published results for secondary minerals from the drill hole ODP 504B. Analysis of my ancient basalts show that they are composed of minerals pretty similar to those formed on modern day seafloor!